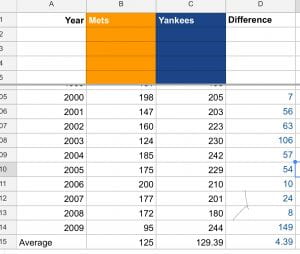
The sheet shows the amount of home runs team hit. Each row is a different year and each column is a diffrent team. The new Column I added shows how many more runs a team hit. If it’s blue that hows many more the Yankees got. And if it’s orange it’s how many more the Mets hit. The formula I did was C minus B whatever row it was.
