
In social studies we have been studying Westward Expansion. Our assignment was to make an infographic all about Westward Expansion (right), and another on an event within Westward Expansion, I chose Louisiana Purchase (left).
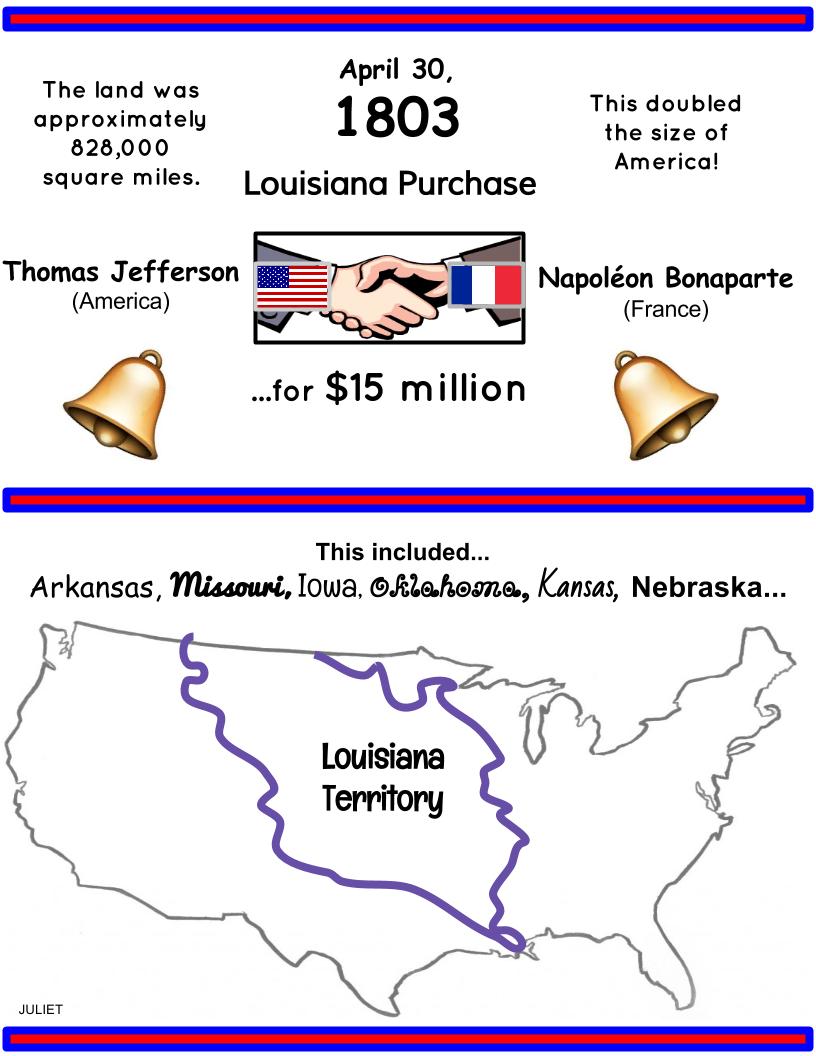
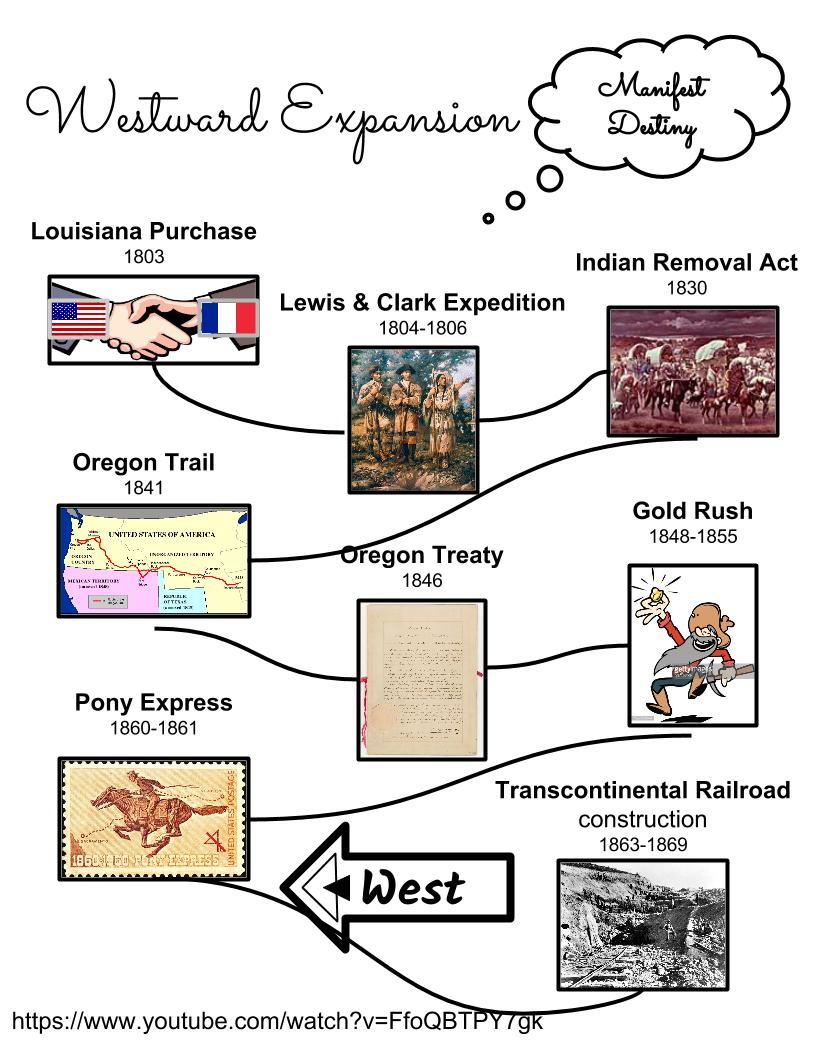
When we were first assigned this project I had no idea what an ‘infographic’ was. As we learned more about the assignment I learned that it is a image such as a chart or diagram used to represent information or data. I spent a lot of time working on how to make it look visually appealing, and tried to find pictures that represented the topic well.