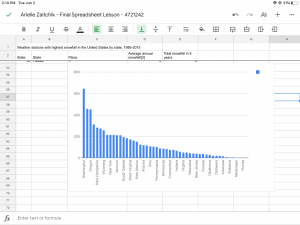
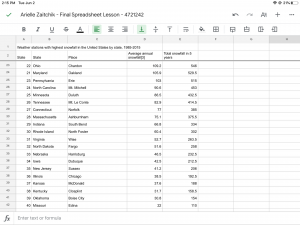
I did the worksheet about the snowfall in different states. I noticed that it was annually which means in a year, so the column that I added on was how much snowfall there was in 5 years. This helped me understand the amount of snowfall there would be in a larger amount of time. My chart showed which ones were the highest amount and it showed about how much it was.

